


Totalview
Introduction
TotalView is a powerful debugger that can be used to debug complex code, including serial, multithreaded (Pthreads, OpenMP, etc), multiprocess (MPI) and GPU applications. It provides a variety of features that can help you find and fix bugs, including:
- Breakpoints
- Watchpoints
- Stepping
- Examining variables
- Tracing execution
- Profiling
- Replay (Backwards execution or reverse debugging)
Licensing of TotalView at the LRZ
Leibniz Supercomputing Centre provides floating licenses for TotalView and Replay Engine on its High-Performance Computing platforms.
Prerequisites
Access to any of the LRZ clusters.
Compile your application in debug mode with the -g flag. e.g: `gcc -g –o my_prog my_prog.c` or `cmake -DCMAKE_BUILD_TYPE=Debug ..`
or:
Compiler | switches for Compilation | switches for Linkage | Remarks |
|---|---|---|---|
ifort/mpif90 (Intel) |
|
|
|
icc/icpc/mpicc/mpiCC (Intel) |
|
|
Notes:
- It is recommended to switch optimization on in addition to adding debugging symbols since otherwise the code (built at -O0) may be quite slow.
- If you use self-built libraries it may be advisable to generate debug versions of these as well.
- The debugger should also work with other compilers available on the LRZ HPC systems. Switch settings may require modifications for these, please check the compiler documentation.
Start a debugging session in TotalView
Step 0: Connect to an LRZ cluster and setup the environment
Once you are connected to any of the LRZ clusters (see specific instructions here), load the Totalview module and other modules necessary for executing your application:
module load totalview
Step 1: Launch TotalView
Start the TotalView GUI with no debug session:
totalview &
Important Note:
The TotalView GUI should open on your local machine when launching TotalView.
In case of an error:
- Make sure you have enabled GUI (X11) forwarding while connecting to the cluster. e.g. with the
-Yflag like this: `ssh -Y lxlogin3.lrz.de -l my_account`. - Make sure you have an X11 server running on your local machine. This is needed to view the GUI forwarded by ssh via the X11 server on the cluster. For Linux users this should not be an issue, for MacOS users you can either use VNC to connect to the cluster or install an X11 server like XQuartz.
Step 2: Create a new Debugging Session
1. On the "File" menu, select "Debug a Program" or "Debug a Parallel Program" from the dropdown menu.
OR: on the Start Page click on "Debug a Program" or "Debug a Parallel Program"
2. In the displayed "New Session" dialog,
- it is suggested that you give your debug session a name, otherwise, it is not saved.
- choose the filename of the program to be debugged. (this is required)
- if you have selected "Debug a Parallel Program", then you are required to select, the type of Parallel System your program will run on. Select the target "MPI" implementation or the appropriate parallel programming model. Then fill in related parameters like the number of Tasks and Nodes involved.
3. Optionally, you can configure the session settings like the executable path, command-line arguments, and environment variables as well as Reverse Debugging, CUDA debugging, Memory Debugging etc.
4. Click "LOAD SESSION" to create the session. If you have compiled in debug mode -g, the source codes for the application will be displayed, otherwise recompile and start over.
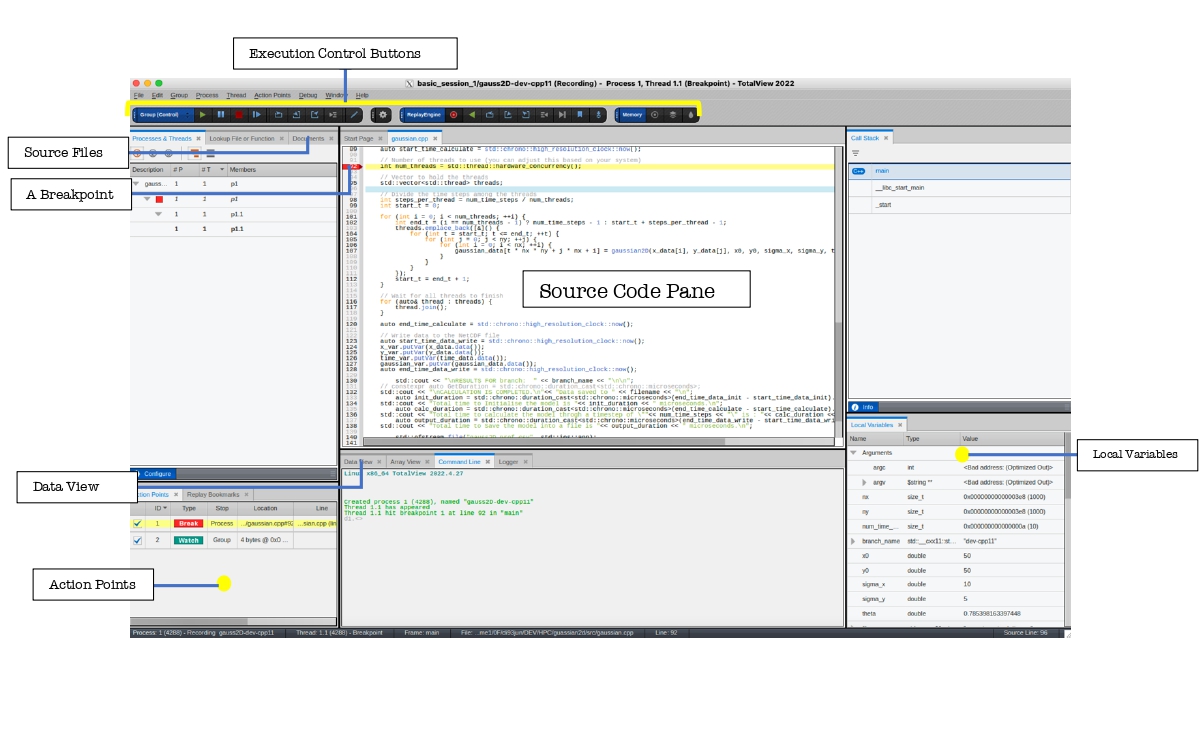
A screenshot sample of a TotalView Debug session
After successfully starting a debug session, the TotalView GUI should look like:
Working with TeamView features
Setting Breakpoints
Breakpoints allow you to pause the execution of a program at specific points that correspond to executable lines in the code. This can be useful for finding bugs, examining variables, or tracing execution.
TotalView displays the source code of the program.
To set a breakpoint:
Click on the line of code where you want to set the breakpoint. A red mark is displayed on the line number to indicate the presence of a breakpoint.
Inspecting Variables
While the program is paused at a breakpoint, you can inspect the values of variables. This can be useful for finding bugs or understanding the flow of data through a program. There are two UI panes for inspecting variables:
- "Local Variable" Pane: this is found on the right side of the GUI. By default, all the local variables active within the scope of the breakpoint are shown here. Each variable's name, type and current value are displayed.
- "Data View" Pane: is found right below the "Source Code" pane. To have a variable displayed here, type in the name of the variable and press Enter. You can also right-click on the variable and choose "Add to Data View".
Setting Watchpoints
Watchpoints are similar to breakpoints, but they allow you to stop the execution of a program when a specific variable changes value or is accessed. This can be useful for finding memory leaks or tracking the flow of data through a program.
To set watchpoints, you need to have an active execution running or pause. In the "Action Point" menu, click "Create Watchpoint". In the openned dialog box enter the name of the variable for the watchpoint. Watchpoints are displayed along with Breakpoints inside the "Action Point" pane.
Controlling the Execution
During debugging, you can control the program's execution by stepping through the source code and executing it line by line. In TotalView, use the following buttons in the toolbar:
The "Group (Control)" toolbar steps the execution forward.
- Go: (shortcut G) Start or continue program execution
- Next: (shortcut N) Execute the current line and pause at the next line (don't execute the next line yet).
- Step: (shortcut S) Start executing the current line, for any subroutine/function encountered, step inside its code and pause at the first line.
- Out: (shortcut O) Execute the current line and the remaining part of this subroutine/function and pause at the line that calls this subroutine/function.
- Run To: (shortcut R) When a line is selected - execute the program and pause at this line.
The "Replay Engine" toolbar steps the execution backwards.
- Record: activates the replay engine, thus enabling Reverse debugging
- Previous: (shortcut Alt+Shift+N) performs the same action as Next but in the opposite direction.
- UnStep: (shortcut Alt+Shift+S) performs the same action as Step but in the opposite direction.
- Caller: (shortcut Alt+Shift+O) performs the same action as Out but in the opposite direction.
- Back To: (shortcut Alt+Shift+R) performs the same action as Run To but in the opposite direction.
Analyzing Parallel Processes and Threads
TotalView allows you to debug multiple processes and threads simultaneously. You can switch between different processes and analyze their state:
- Click on the "Processes & Threads" tab in the "Process View" panel to see a list of all running processes.
- Double-click on a process or thread to switch to it and inspect its state.
- Use the standard debugging tools (breakpoints, variable inspection, etc.) to debug multi-threaded and multiprocess programs effectively.
Attaching to Already Running Programs
Select the File > New Program command, select Attach to process, click on the program’s name, and then press the OK button.
If you don’t see the program, use the ps command to determine its PID (Program ID), and then select the PID within the File > New Program dialog box.
Always attach to a program’s main thread.
Other Useful Features
TotalView offers many other powerful features to aid your debugging process, such as:
- Memory Debugging: To detect memory-related issues like memory leaks and invalid memory access.
- Watchpoints: To pause the program when a specific memory location is accessed or modified.
- Call Stack: To view the call stack and trace the flow of program execution.
- Evaluation Points: To write and execute expressions, which initialise a pause when the value changes.
TotalView's official documentation (highly recommended)
The link to the slides and the TotalView usage presentation can be found here: https://doku.lrz.de/debugging-with-totalview-2499907462.html
https://help.totalview.io/current/HTML/index.html
TotalView webinar 2023 at LRZ : TV Webinar July 2023.pdf