


ARM Forge (formerly Allinea DDT)
ARM Forge contains the parallel debugger DDT, which is used at LRZ to debug parallel application.
Official Documentation
For indepth description of ARM Forge including detailed useage of DDT please look at the official ARM documentation https://developer.arm.com/documentation/101136/latest
Using DDT
First, it is strongly recommended you clean and rebuild your code with debugging symbols For most compilers (C/C++ and Fortran) this is achieved with the -g option.
Additionally, you might specify other options, described briefly in the table below:
| Compiler | Options | Remarks |
|---|---|---|
| icc/icpc/mpicc/mpiCC | -g -O2 -traceback | -traceback for C code mixed with Fortran |
| fort/mpif90 | -g -O2 -check all -traceback | -check all activates runtime error checking and may have performance impact. Refer to the compiler documentation for other check options, i.e., -check bounds |
| gcc/g++ | -g -O2 | |
| gfortran | -g -O2 -fbacktrace -fcheck=<all|bounds> | The use of -fcheck might impact severely performance. Consult the man page for detailed information. |
Now you should load the the appropriate environment module and call the ddt command
  module load ddt
  ddt
As represented in Figure 1, DDT gives you the option to debug a program, launch manually a program, attach a running program or open core files
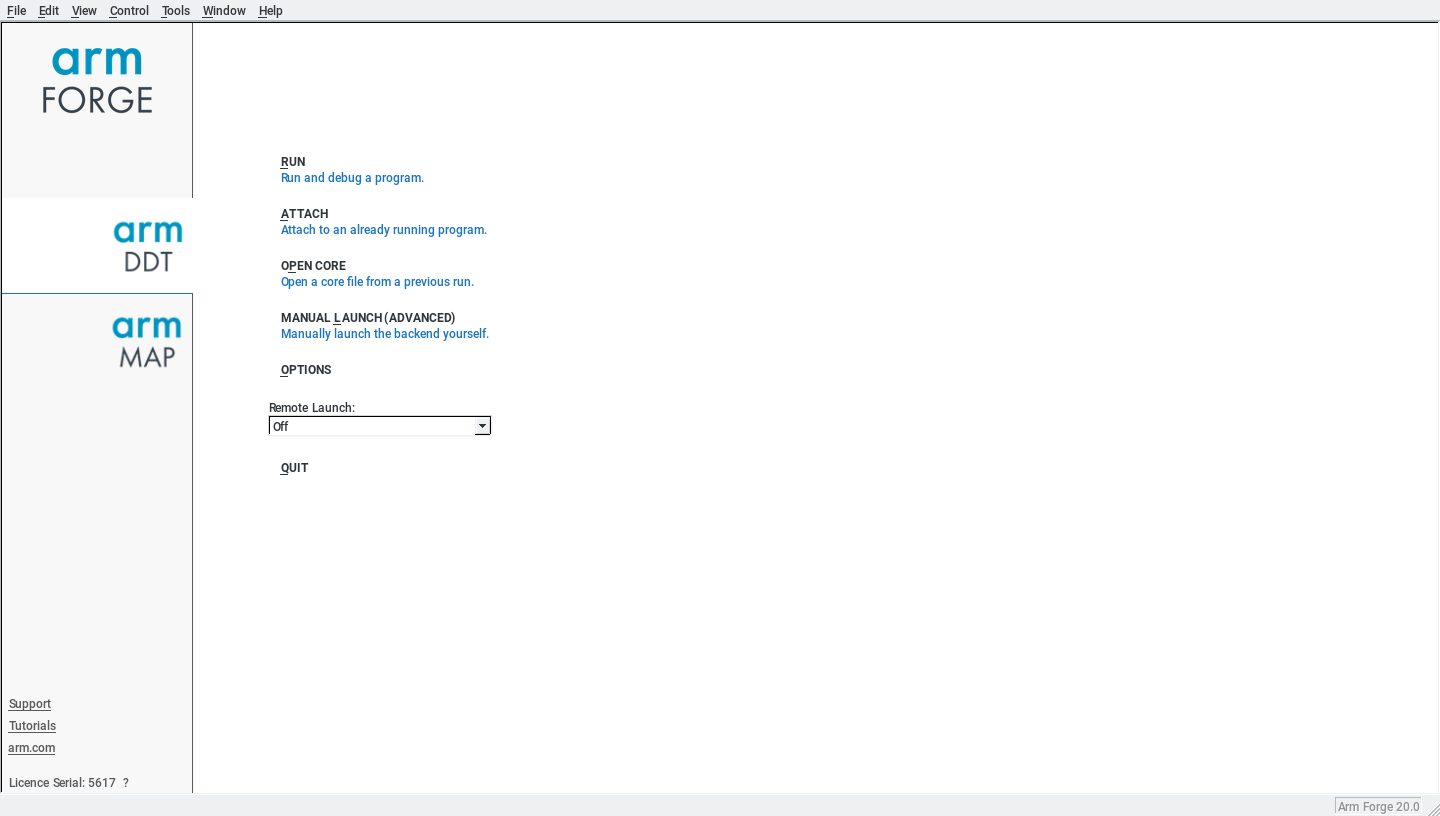
Figure 1. DDT main menu
If you choose to Debug a program, DDT will be automatically integrated with the Slurm "workload manager" / "job scheduler" used on the HPC systems at LRZ. Thus, DDT will generate a corresponding batch job and will connect to the compute nodes when the program starts execution.
As shown in Figure 2 the executable and the corresponding parameters can be specified. Memory debugging and other features can be activated by selecting the tick box and configuration options can be accessed by clicking on the adjacent tabs.
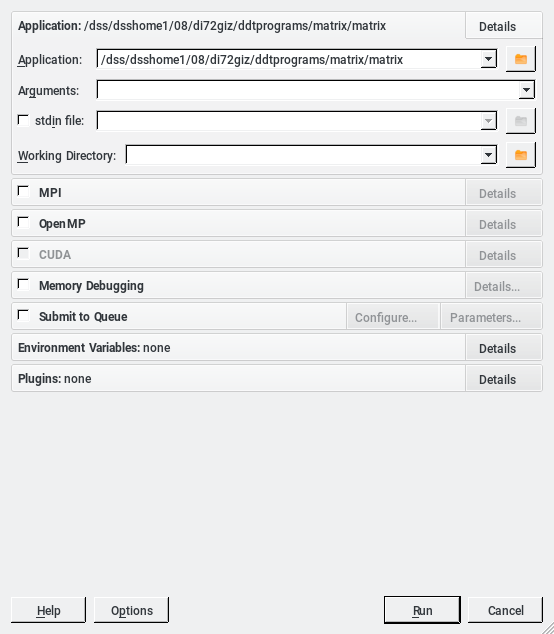
Figure 2. Run Window.
If you haven't used ddt from your account or the ~/.allinea directory is missing you will need to perform the initial configuration setup. To do this click on the Options button as illustrated in figure 2 and the window shown in figure 3 comes up.
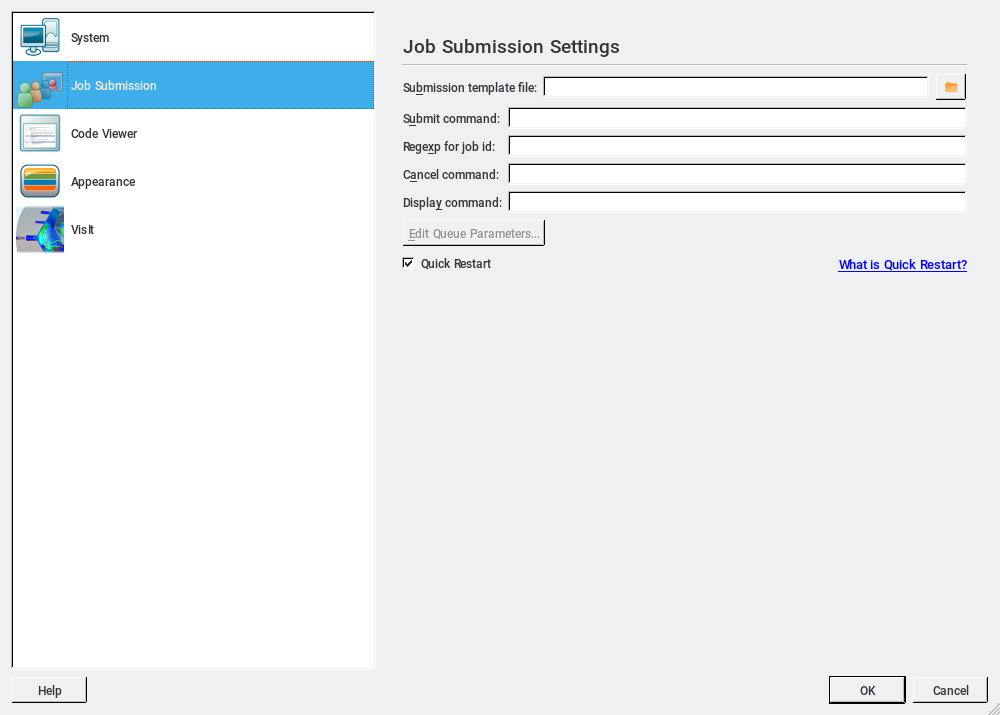
Figure 3. Configuration and initial setup.
Next select the Job Submission icon and the Job Submission Settings window should be unpopulated as illustrated in figure 3. Now choose a Submission template file by clicking on the icon and the window in figure 4 appears.
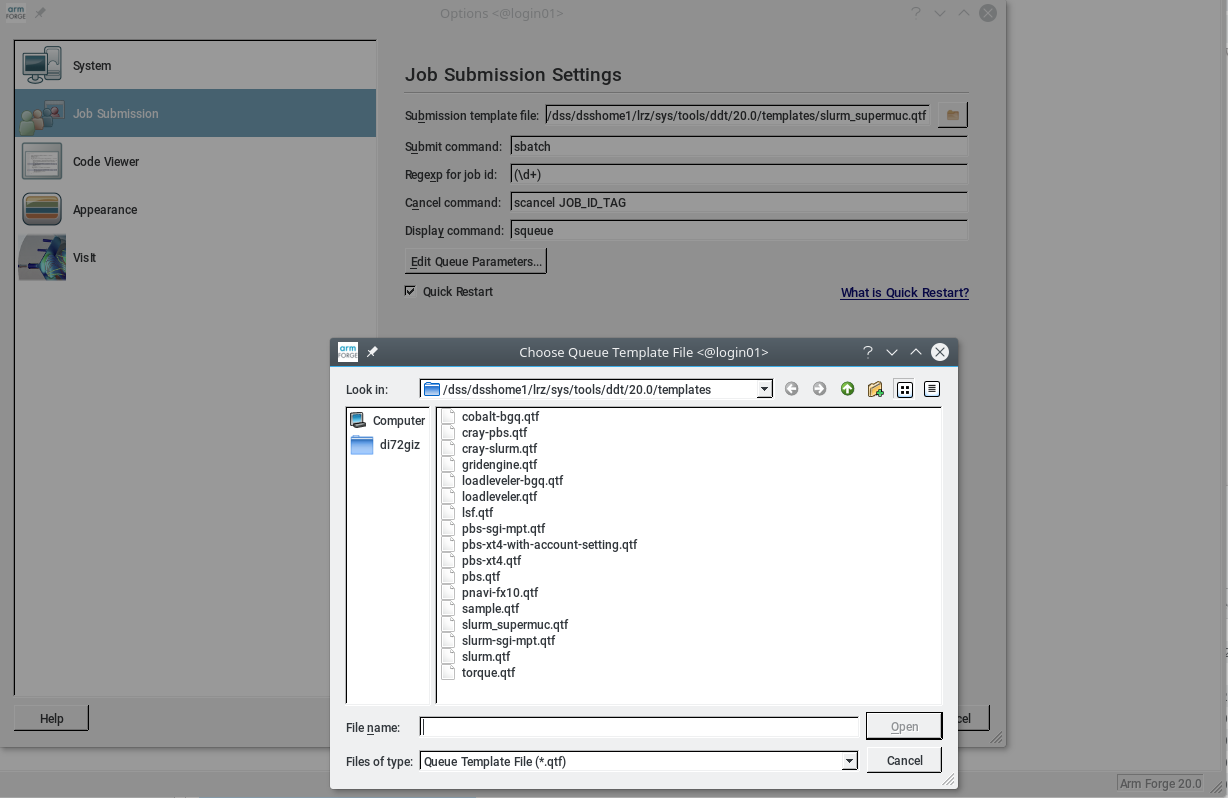
Figure 4. Select template file.
Select the slurm_supermuc.qtf file and the Job Submission Settings window should look like figure 6. Then click on the System icon and it should be populated as shown in figure 5. Now the initial configuration set up is done and only has to be redone if the ~/.allinea directory has been removed.
Execution Setup:
The user is also advised to specifiy the number of nodes along with the number of cores per node (through the PROCS_PER_NODE_TAG). Programs can be scheduled to the test or general queues. Refer to the LRZ Slurm submission site for information about limits and resources available on each queue. Keep in mind, the waiting times on each queue might increase with the amount of resources (compute nodes or Wall Clock limits) your request.
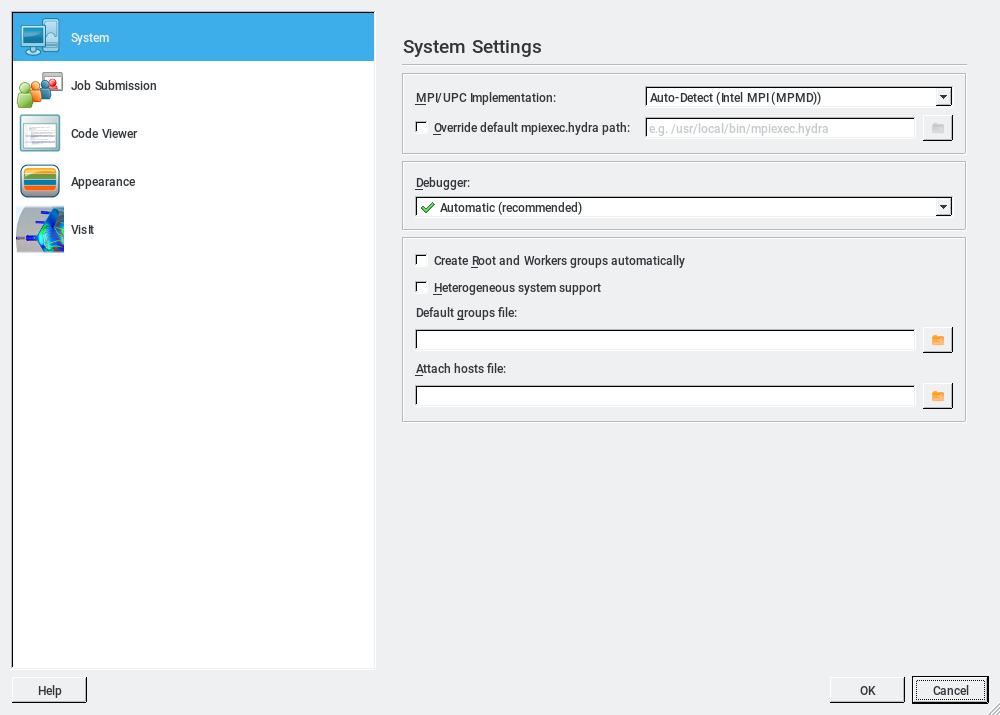
Figure 5. Parallel Environment
As show in Figure 5, you could specify, for example, intel-mpi if you want to debug programs with Intel MPI.
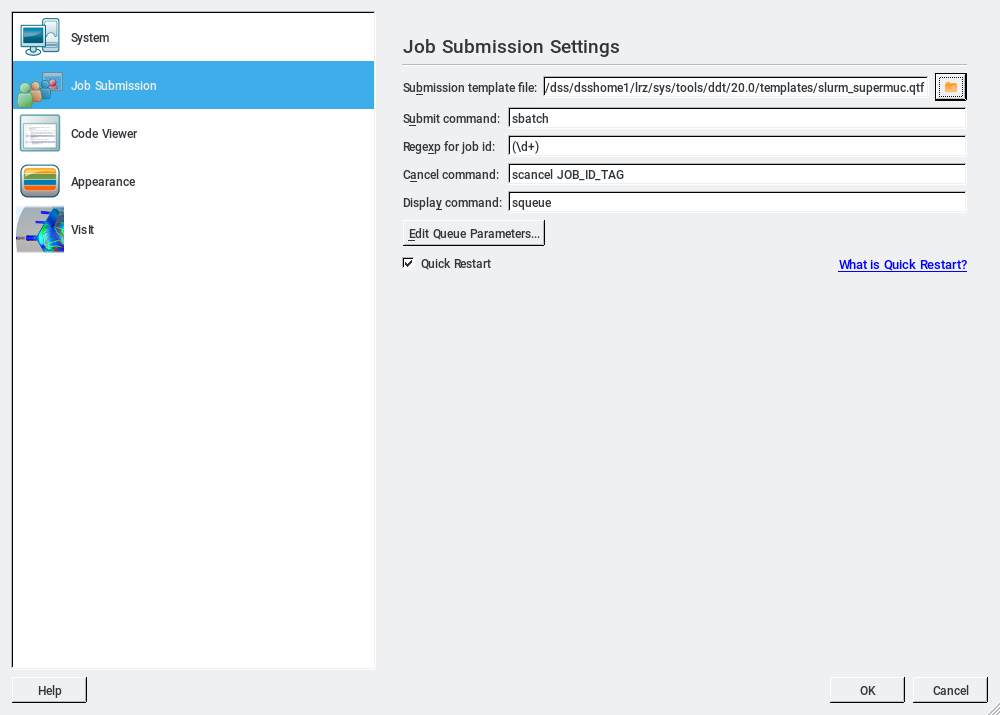
Figure 6. Batch job templates
In figure 6 you can select a template for the job script that DDT will use to launch your program. Default is Intel MPI. For different MPI versions, create a slurm_vendor_mpi.qtf file, located in the $HOME/.ddt subdirectory. This directory will be generated with your own preferences when you load the ddt module for first time. Any modification or fine adjustment you do will be preserved in the $HOME/.ddt_templates directory.
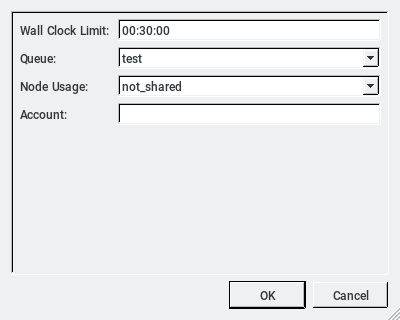
Figure 7. Queue submition parameters.
In the job submittion window, it is possible to specify the number of processors per node with the value of PROCS_PER_NODE_TAG. A maximun of 40 can be allocated.
On the Queue Submission Parameters windows, figure 7, it is possible to tell change the queue, the class job (parallel or MPICH) , the number of MPI Tasks and OpenMP threads and the wall time.
Finally, Slurm will decide when your batch job should start. Once your job is running you will be able to use the control buttoms (play, pause, step, etc.), or add break and watch points. Refer to the documentation for a complete description of options.
Debugging Options
Documentation
We recommend to read the documentation provided by ARM: https://developer.arm.com/documentation/101136/latest